Forecast Irrigation Schedules, Flow Rate and Total Water Usage with Dryrun™
Dryrun™ allows you to forecast irrigation schedules by controller. You can forecast stations running at any time, minute-by-minute flow rate, total water usage and program(s) runtime. Dryrun has three display options making it easy to view flow rate, programs, stations, and time duration. To start Dryrun select the output you would like to display (chart, schedule, or list), select days from preset 1, 3 or 7 days, or you can set a custom day range from 1 to 31 days. Click on Run.
DISPLAY OPTIONS
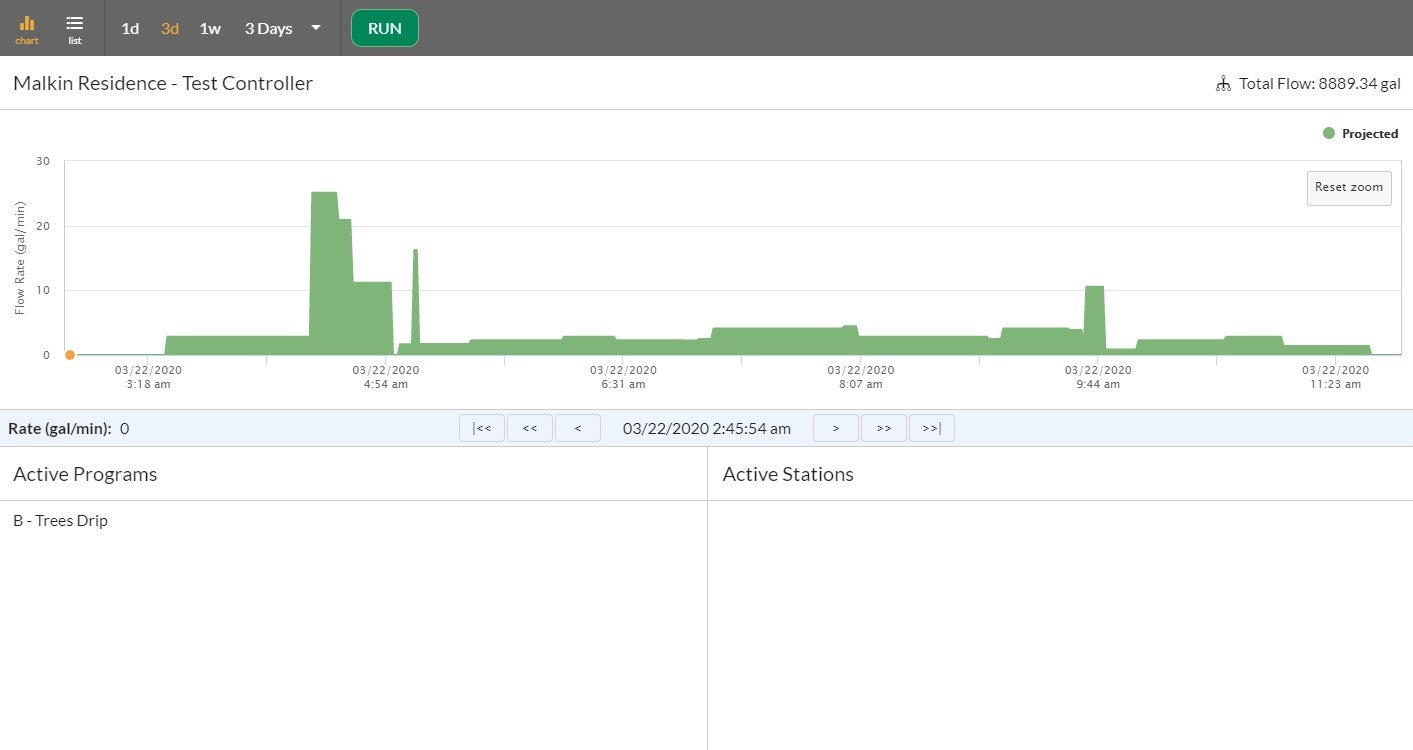
Graph
Displays a graphical presentation of forecast runtimes with details of which programs, stations, flow amounts and time duration. Use the easy-to-use zoom feature when you need to look click and hold the left mouse button and drag across the area to be expanded
Click on the Reset Zoom button in the upper left corner to reset it to the original time period selection
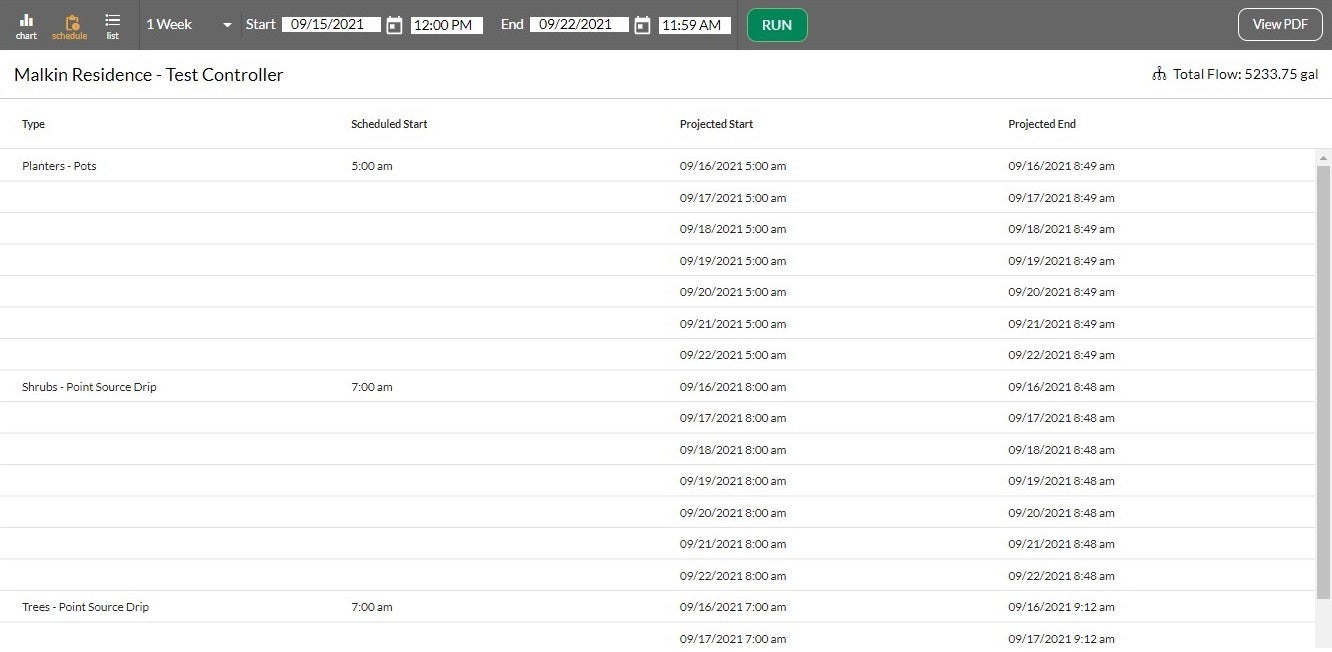
Schedule
Displays forecast based on the irrigation type showing the scheduled start time, projected start time, and projected end time for each day.
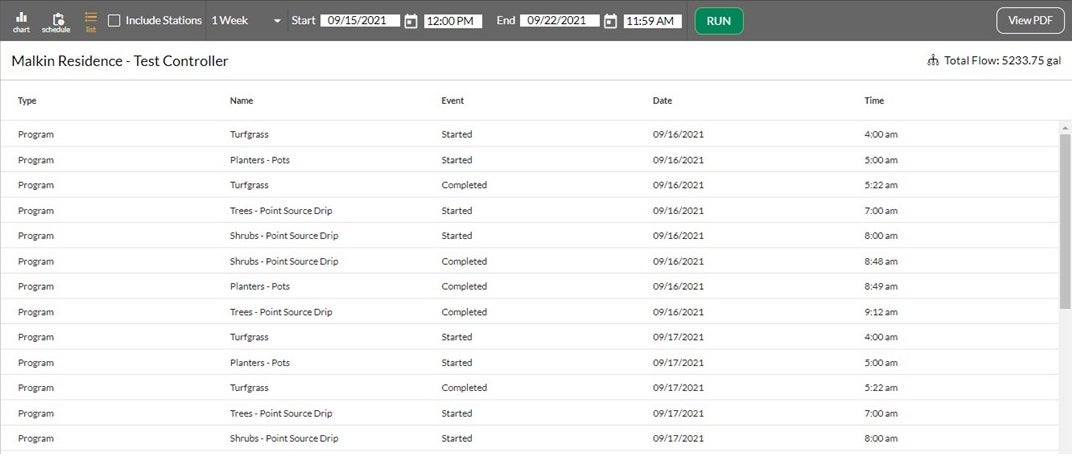
List
Displays forecast in a list based on programs showing the start and end time. Non-irrigation stations are not shown in the graphical display but are shown in the list display.
Interactive Simulator
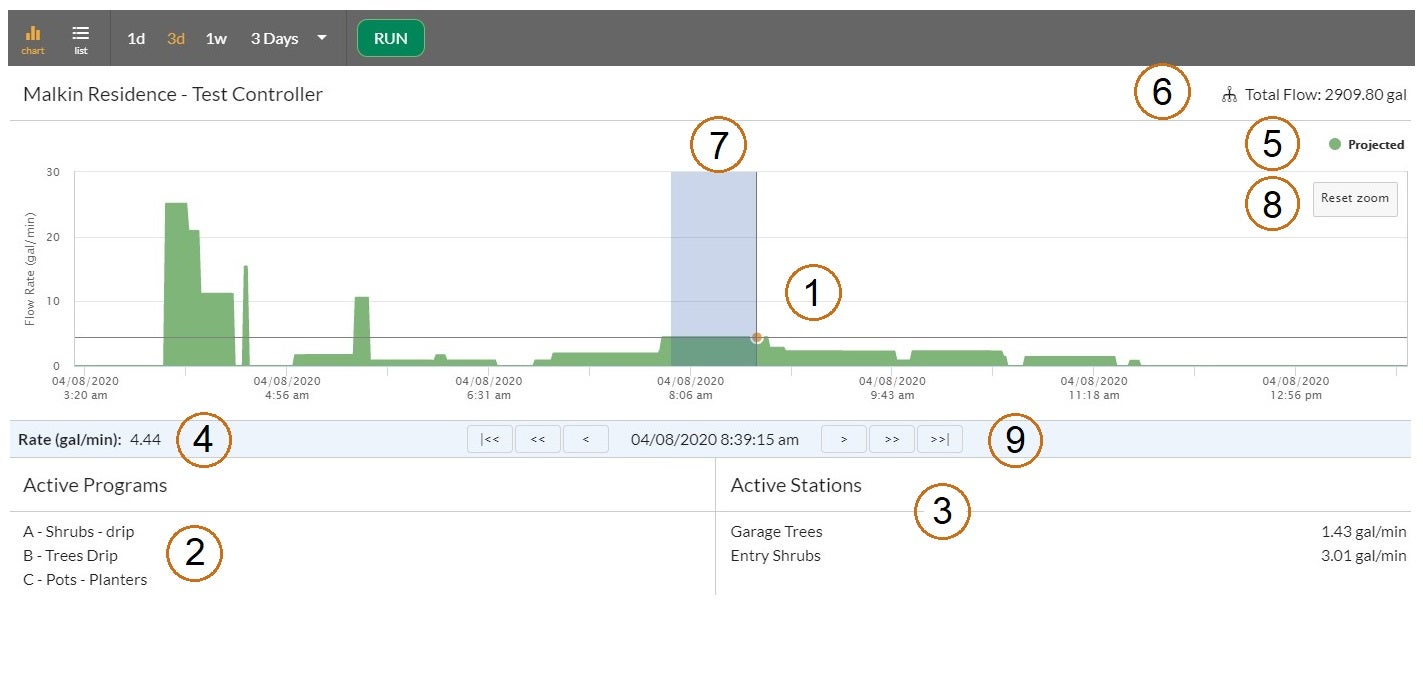
The Dryrun simulator is an interactive simulation of the projected program/station operation and flow of water over time. The simulation uses the selected controller's current configuration properties (including modules, flow rates, programs, etc.) to create an easy-to-understand snapshot projected watering output. The Dryrun Simulator also allows you to interact with the simulation, giving you the ability to move a cursor to display system status at one-minute intervals in time.
- Pointer — Move the mouse pointer across the chart to display details in the status area at the bottom of the screen. Tip: You can adjust the position of the pointer on the horizontal axis to one minute accuracy by using the Pointer Advance buttons to move the pointer.
- Active Programs — Active Programs displays the programs running at the selected time
- Active Stations – Active Stations displays the stations running at the selected time
- Rate — When using the Pointer function, this line shows the current flow rate.
- Projected -- The vertical height of the green bar(s) indicates the volume of water programmed to flow at the time directly below the bar on the horizontal axis.
- Total Flow – displays the total projected flow for the original time period selected
- Zoom – Click and hold the left mouse button while moving the pointer across the chart to zoom into a smaller time period
- Reset Zoom – resets the zoom window to the original selected time period
- Pointer advance buttons — These buttons provide navigation along the timeline with better resolution than using the mouse pointer alone. Each button moves the pointer either right or left along the timeline in small increments.
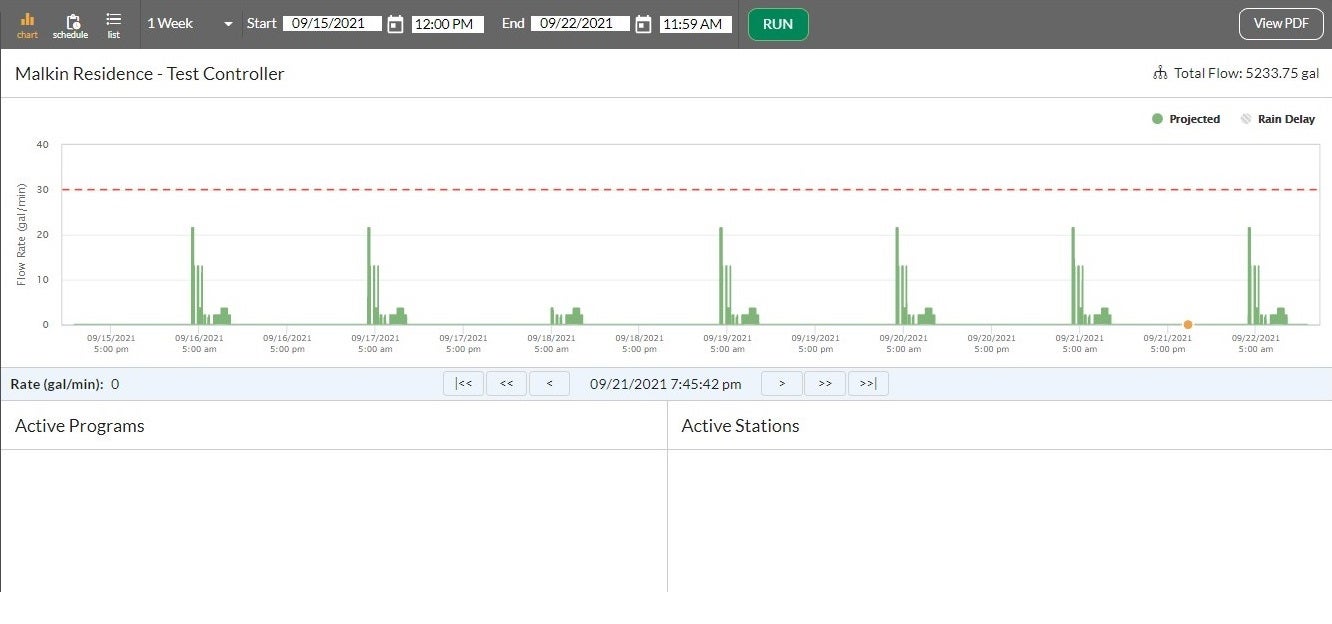
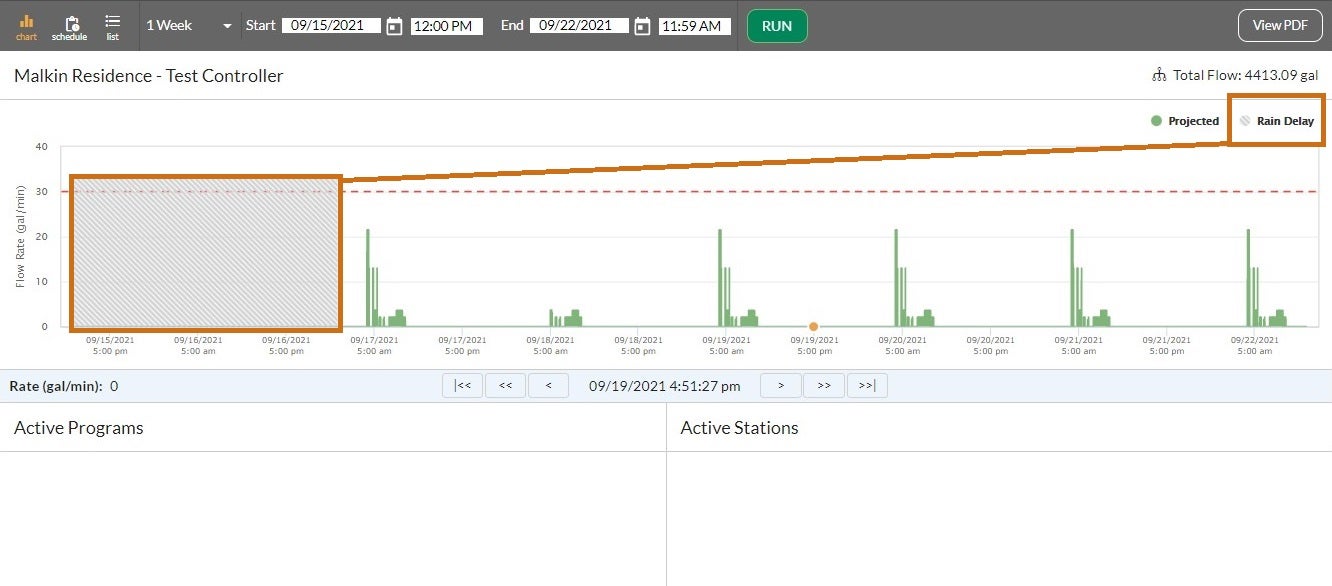
With Rain Delay
If there is a Rain Delay set, the Dryrun will take that into account and you will see a hash area
To use Dryrun you’ll need to set-up the following before:
- Controller setup
- Flow sensors
- Master valves
- Stations
- Programs
- Controller level SimulStations
- FloManager
- Controller parameters (Auto/Off, Auto Sync, Auto Retrieve, etc.)
- Rain delay
- Program Setup
- Start time(s)
- Day(s) of operation
- Program level SimulStations
- ET adjust, program adjust
- Station Setup
- Flow rate(s) (manual and learned flow)
- Base runtime(s)
- Decoder/IVM addresses
- FloZone assignments