Irrigation Design Tip: Determining Water Supply Requirements
There are two critical pieces of information that you need to determine about the water supply. First, you must determine the flow in gallons per minute (meters cubed per hour or liters per second) available for the irrigation system. The second number is the working pressure in pounds per square inch (bars) at the point-of-connection (POC) for the system for the previously determined flow.
The following site information will help you determine these numbers:
- static water pressure
- water meter size
- service line size
- service line length
- type of service line pipe
Static Water Pressure
The static water pressure should be measured by a pressure gauge reading, or obtained from the water purveyor. Remember that the lower pounds per square inch (bar) figure for the summer, daylight pressure (or “worst case” condition) is the number to use.
Water Meter Size
The size of the water meter is usually stamped or cast somewhere on the upper half of the meter. Sometimes the size is printed inside the reading lid of the meter, right next to the dials. Typical water meter nominal sizes include 5/8 in, 3/4 in, 1 in, 1-1/2 in and 2 in (18 mm, 20 mm, 25 mm, 40 mm and 50 mm). If you are unable to find the water meter size, contact the water purveyor. The size of the meter can be a determining factor in the flow available for the system.
Service Line Size
The service line sizes are necessary to figure out which pipe flow loss chart to use. The line may be a completely different size than the meter. The length of this line will be used with the appropriate pipe chart when determining the working pressure at the point-of connection.
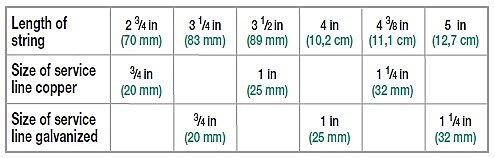
If you can’t find the service line size, the “Estimated Service Line Sizes” chart below and in the Technical Data section the Irrigation Design Manual will show you how to wrap a string around the pipe and measure the string to determine the pipe size.
Calculating water meter capacity and working pressure
To find the flow in gallons per minute (meters cubed per hour or liters per second) available for irrigation we use three rules. Each of these rules will give us a result expressed as gallons per minute (meters cubed per hour or liters per second). When you have these three values you will use the most restrictive value (lowest flow) as the available flow for the system.
Rule #1
The pressure loss through the water meter should not exceed 10% of the minimum static water pressure available in the city main.
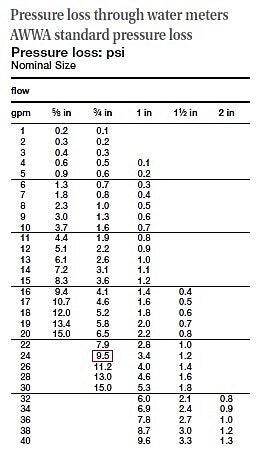
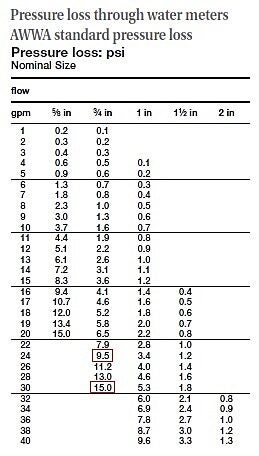
This rule prevents heavy pressure loss from occurring early in your system. To make sure this pressure loss limit is not exceeded, we restrict the flow through the meter. To ascertain this flow limit, look at a water meter flow loss chart. This chart is set up much like a pipe flow loss chart. The gpm (m3/h or L/s) flows are listed in the right and left hand columns, the meter sizes are listed across the top of the chart and the flow losses in pounds per square inch (bars) are listed under each size of water meter.
Consider this example, the site has a 3/4 in (20 mm) water meter and the main line static pressure is 111 psi (7,7 bar). If we can only accept a loss of 10% of this 111 psi (7,7 bar), then we need to know the flow in gallons per minute (meters cubed per hour or liters per second) that will produce a loss of about 11 psi (0,77 bar).
Read down the column under the 3/4 in (20 mm) size in the water meter flow loss chart until you find the closest pound per square inch (bar) loss at, or just below, 11 psi (0,77 bar). In this example, 9.5 psi (0,77 bar) is the closest pound per square inch (bar) loss that does not exceed 11 psi (0,77 bar). According to the chart, 24 gpm (5,90 m 3/h or 1,64 L/s) is the flow to satisfy rule number one.
Rule #2
The maximum flow through the meter for irrigation should not exceed 75% of the maximum safe flow of the meter.
This rule is designed to protect the water meter from excess demand. If a system is designed with a flow that over-taxes the water meter, the unit will eventually fall out of calibration and ultimately fail.
Looking back to the water meter flow loss chart for the column under the 3/4 in (20 mm) size, read down to the last pound per square inch (bar) loss number listed. This loss corresponds to the gallons per minute (meters cubed per hour or liters per second) flow in the left-hand column that is the maximum safe flow for the 3/4 in (20 mm) water meter. Fifteen psi (1,0 bar) is the last loss listed and reading across the column, we see that this is caused by a flow of 30 gpm (6,80 m3/h or 1,89 L/s).
Applying the second rule, we calculate 75% of this 30 gpm (6,80 m3/h or 1,89 L/s) safe flow so we are limited to:
30 gpm x .75 = 22.5 gpm
6,80 m3 L/s x .75 = 5,10 m3/h
1,89 L/s x .75 = 1,42 L/s
Rule #3
The velocity of flow through the service line should not exceed 5 to 7-1/2 ft/s (1,5 to 2,3 m/s).
This is similar to the 5 f/s (1,5 m/s) rule we covered in Chapter 1 of the Irrigation Design Manual. Holding the velocity at 5 ft/s (1,5 m/s) is suitable for thermoplastic pipe, but this criteria is overly restrictive and impractical with the metallic pipe commonly used in the water purveyor’s delivery system. Because the 3/4 in (20 mm) water meter in our example has a 3/4 in (20 mm) copper service line, we can look up the required flow limit in the flow loss chart for copper pipe. Under the 3/4 in (20 mm) size, find the highest flow that creates a velocity at, or immediately below, 5 ft/s (1,5 m/s).
In the velocity column under that size, we can read down to the highest velocity that does not enter the shaded area on the chart. For 3/4 in (20 mm) copper water tube, the limit of 4.41 ft/s (1,34 m/s) corresponds to a flow limit of 6 gpm (1,36 m3/h or 0,38 L/s). This is so restrictive that we will use 7.5 ft/s (2,29 m/s) as the limit and see what flow that velocity allows.
According to the chart, 7.35 ft/s (2,24 m/s) is produced at a flow of 10 gpm (2,27 m3/h or 0,63 L/s) for 3/4 in (20 mm) copper tube. This places our velocity in the shaded area on the chart and still only gains us 4 gpm (0,91 m3/h or 0,25 L/s). This is typical of the types of problems a designer may run into on a project. We will see in a moment how the designer contends with this small service line situation.
The three rules-of-thumb have given us three limits:
#1: The 10% static pressure loss through water meter rule...
24 gpm (5,44 m3/h or 1,51 L/s) limit
#2: 75% of meter’s safe flow rule...
22.5 gpm (5,10 m3/h or 1,42 L/s) limit
#3: 5 to 7.5 ft/s (1,5 to 2,3 m/s) velocity rule for service line...
10 gpm limit (2,27 m3/h or 0,63 L/s)
Of these three rules for calculating the flow for the irrigation system, we will choose the flow that is the most restrictive to establish our system capacity. In the above examples, the most restrictive is the service line rule where the flow capacity for the system is 10 gpm (2,27 m3/h or 0,63 L/s). With the available flow understood, the working pressure for the system can now be determined.
To calculate working pressure, we take the 10 gpm (2,27 m3/h or 0,63 L/s) flow through all the components of the water service system right up to where we will cut into the service line to start the sprinkler system. The place where the designer determines to start the irrigation main line is called the point-of-connection (POC). From the source to the POC, we will calculate the friction (or flow) loss through all those components, take into account any elevation losses or gains and calculate the remaining working pressure.
Following these calculations, we will have the dynamic pressure in pounds per square inch (bar) at a flow of 10 gpm (2,27 m3/h or 0,63 L/s). These are the two critical numbers needed to start designing the irrigation system.
In the Irrigation Design Manual there are practice exercises you can use to reinforce what you have learned in this tip.
Read our past tips about Hydraulics, Climate and Soil Type.